import math
import pandas as pd
import numpy as np
from plotly.subplots import make_subplots
import plotly.graph_objects as goThis notebook contains the code used to generate the sampling visualizations shown on the site. It is intended for exploration and modification rather than step-by-step instruction.
User Configuration
Parameters in this section can be modified to explore different sampling behaviors.
RANDOM_STATE = 42counts = {
"Red": 25,
"Green": 25,
"Blue": 25
}color_map = {
"Grey": "rgb(165, 165, 165)",
"Red": "rgb(255, 0, 0)",
"Green": "rgb(0, 180, 0)",
"Blue": "rgb(0, 0, 255)"
}sampling_config = {
# --- Deterministic selection ---
"Deterministic selection 100%": {
"frac": 1.0,
"is_subset": True,
"replace": False
},
"Deterministic selection 50%": {
"frac": 0.5,
"is_subset": True,
"replace": False
},
"Deterministic selection 25%": {
"frac": .25,
"is_subset": True,
"replace": False
},
# --- Random selection (no replacement) ---
"Random selection no replacement 100%": {
"frac": 1.0,
"is_subset": False,
"replace": False
},
"Random selection no replacement 50%": {
"frac": 0.5,
"is_subset": False,
"replace": False
},
"Random selection no replacement 25%": {
"frac": .25,
"is_subset": False,
"replace": False
},
# --- Random selection (with replacement) ---
"Random selection with replacement 100%": {
"frac": 1.0,
"is_subset": False,
"replace": True
},
"Random selection with replacement 50%": {
"frac": 0.5,
"is_subset": False,
"replace": True
},
"Random selection with replacement 25%": {
"frac": .25,
"is_subset": False,
"replace": True
},
}SUBPLOT_PARAMS = {
"rows": 3,
"cols": 3,
"horizontal_spacing": 0.02,
"vertical_spacing": 0.08
}plot_grid = [
[
"deterministic_selection_100",
"random_selection_no_replacement_100",
"random_selection_with_replacement_100",
],
[
"deterministic_selection_50",
"random_selection_no_replacement_50",
"random_selection_with_replacement_50",
],
[
"deterministic_selection_25",
"random_selection_no_replacement_25",
"random_selection_with_replacement_25",
]
]column_titles = [
"DETERMINISTIC",
"RANDOM<br>NO REPLACEMENT",
"RANDOM<br>REPLACEMENT",
]
row_titles = ["100%", "50%", "25%"]max_visible = 4 # cap for opacity scalingFunctions
Data Creation and Sampling
def make_population_df(
    counts: dict,
    x_centers: dict = None,
    x_jitter: float = 0.08,
    y_jitter: float = 0.6,
    seed: int = 42
) -> pd.DataFrame:
    """
    Create a population DataFrame where each row represents a single sample.

    Columns:
    - color: category label
    - color_index: unique index within each color (0-based)
    - global_index: unique index across entire population
    - x, y: fixed spatial coordinates for visualization
    """
    rng = np.random.default_rng(seed)

    if x_centers is None:
        x_centers = {
            "Red": -.5,
            "Green": 0.0,
            "Blue": .5
        }

    rows = []

    for color, n in counts.items():
        for i in range(n):
            rows.append({
                "color": color,
                "color_index": i,
                "x": x_centers[color] + rng.normal(0, x_jitter),
                "y": rng.normal(0, y_jitter)
            })

    df = pd.DataFrame(rows)
    df["global_index"] = range(len(df))

    return df
def compute_draw_count(
df_population: pd.DataFrame,
frac: float,
is_subset: bool,
replace: bool,
random_state: int | None = None
) -> pd.Series:
"""
Compute per-sample draw counts for a given sampling configuration.
Returns
-------
pd.Series
Integer draw counts indexed like df_population.
"""
n_total = int(len(df_population) * frac)
# Initialize all counts to zero
draw_count = pd.Series(0, index=df_population.index)
if is_subset:
# Deterministic: per-color proportional truncation
cutoffs = (
df_population.groupby("color")["color_index"]
.max()
.add(1)
.mul(frac)
.apply(np.ceil)
.astype(int)
)
selected_idx = df_population.index[
df_population["color_index"] < df_population["color"].map(cutoffs)
]
draw_count.loc[selected_idx] = 1
else:
# Random sampling (with or without replacement)
sampled_idx = df_population.sample(
n=n_total,
replace=replace,
random_state=random_state
).index
counts = sampled_idx.value_counts()
draw_count.loc[counts.index] = counts.values
return draw_countdef aggregate_color_rgb(df, draw_col, color_map):
"""
Compute weighted average RGB color for a given draw_count column.
"""
weights = df[draw_col].values
if weights.sum() == 0:
return "rgb(230,230,230)" # fallback, should rarely happen
rgb = np.zeros(3)
for color, rgb_str in color_map.items():
if color == "Grey":
continue
r, g, b = map(int, rgb_str[4:-1].split(","))
mask = df["color"] == color
rgb += np.array([r, g, b]) * weights[mask].sum()
rgb = (rgb / weights.sum()).astype(int)
return f"rgb({rgb[0]},{rgb[1]},{rgb[2]})"Plotly Visuals
def create_subplots_fig(params):
    return make_subplots(**params)
def add_sample_selection_grid(
fig,
df,
plot_grid,
color_map,
max_draw_cap=4,
grey_opacity=0.4,
base_marker_size=8,
):
"""
Add scatter traces showing which samples were selected
under each sampling configuration.
"""
for r, row_cols in enumerate(plot_grid, start=1):
for c, draw_col in enumerate(row_cols, start=1):
draw = df[draw_col]
plot_color = np.where(draw > 0, df["color"], "Grey")
opacity = np.where(
draw > 0,
0.4 + 0.6 * np.minimum(draw, max_draw_cap) / max_draw_cap,
grey_opacity,
)
# Plot grey first, then RGB
for color_name in ["Grey", "Red", "Green", "Blue"]:
mask = plot_color == color_name
if not mask.any():
continue
fig.add_trace(
go.Scatter(
x=df.loc[mask, "x"],
y=df.loc[mask, "y"],
mode="markers",
marker=dict(
size=base_marker_size,
color=color_map[color_name],
opacity=opacity[mask],
),
showlegend=False,
),
row=r,
col=c,
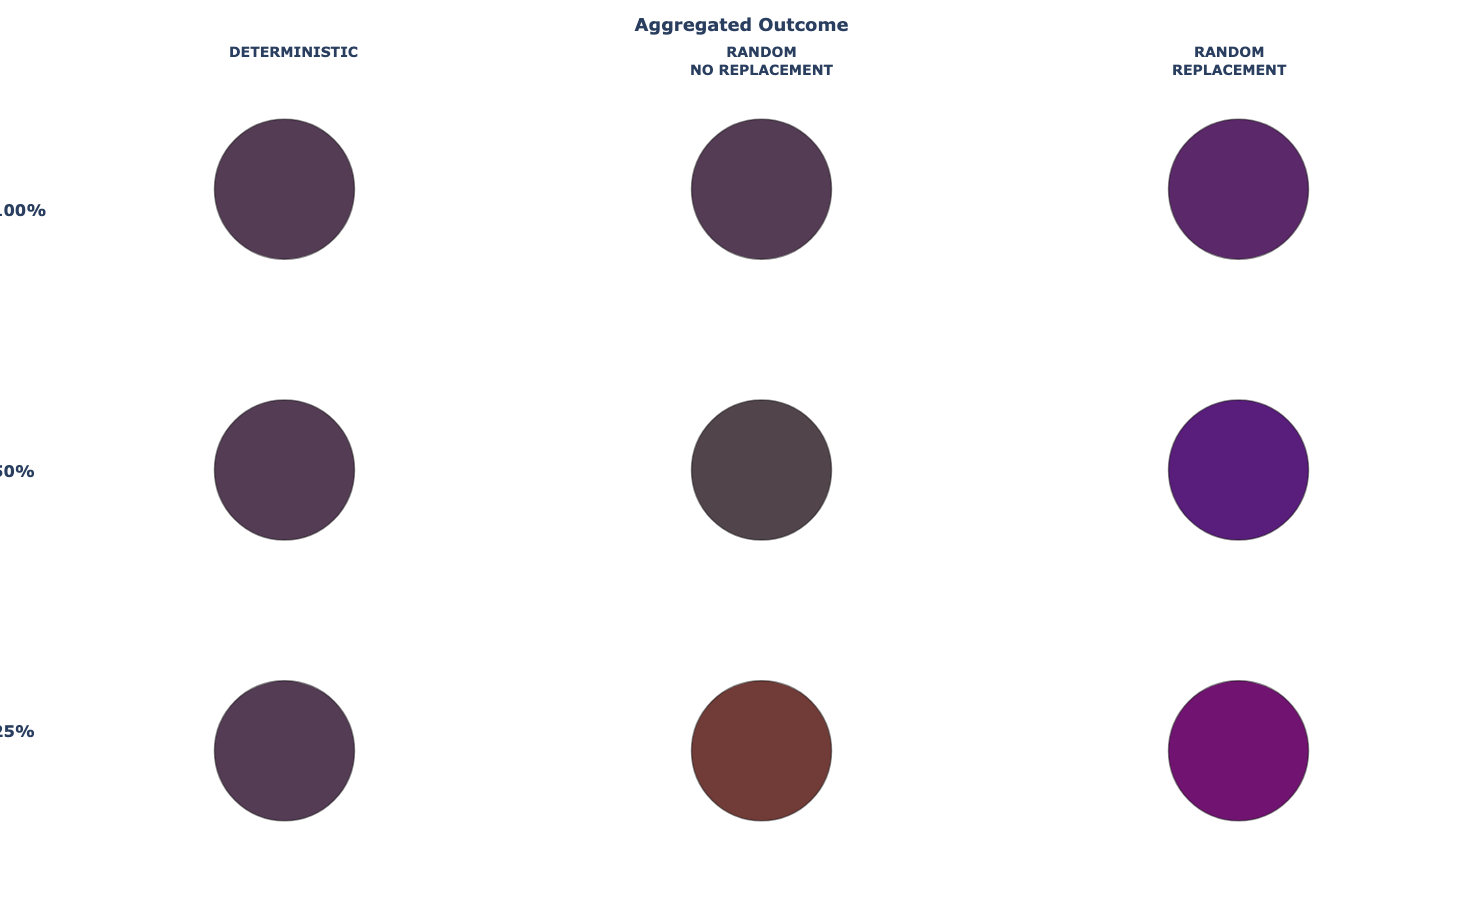
)def add_aggregate_color_grid(
fig,
df,
plot_grid,
color_map,
marker_size=140,
outline_color="rgba(0,0,0,0.45)",
outline_width=1.5,
):
"""
Add one aggregate color marker per subplot based on draw counts.
"""
for r, row_cols in enumerate(plot_grid, start=1):
for c, draw_col in enumerate(row_cols, start=1):
agg_color = aggregate_color_rgb(df, draw_col, color_map)
fig.add_trace(
go.Scatter(
x=[0],
y=[0],
mode="markers",
marker=dict(
size=marker_size,
color=agg_color,
line=dict(
color=outline_color,
width=outline_width,
),
),
showlegend=False,
),
row=r,
col=c,
)def hide_subplot_axes(fig, n_rows, n_cols, axis_range=(-1, 1)):
"""
Hide axes and set consistent ranges across all subplots.
"""
for r in range(1, n_rows + 1):
for c in range(1, n_cols + 1):
fig.update_xaxes(
visible=False,
range=list(axis_range),
row=r,
col=c,
)
fig.update_yaxes(
visible=False,
range=list(axis_range),
row=r,
col=c,
)def add_column_labels(
fig,
column_titles,
n_cols,
y=1.05,
font_size=14,
):
"""
Add column titles centered above each column.
"""
for i, title in enumerate(column_titles):
x_position = (i + 0.5) / n_cols
fig.add_annotation(
text=f"<b>{title}</b>",
xref="paper",
yref="paper",
x=x_position,
y=y,
showarrow=False,
font=dict(size=font_size),
xanchor='center',
)def add_row_labels(
fig,
row_titles,
n_rows,
x=-0.05,
font_size=16,
):
"""
Add row labels, left-aligned.
"""
for i, title in enumerate(row_titles):
y_position = 1 - (i + 0.5) / n_rows
fig.add_annotation(
text=f"<b>{title}</b>",
xref="paper",
yref="paper",
x=x,
y=y_position,
showarrow=False,
font=dict(size=font_size),
yanchor='middle',
)def add_title(fig, title=None):
if title is not None:
fig.update_layout(
title=dict(
text=f"<b>{title}</b>",
x=0.5,
xanchor="center",
font=dict(size=18),
y=.98
)
)def apply_shared_layout(
fig,
height=900,
width=900,
margins=dict(l=60, r=20, t=80, b=40),
background_color="white",
):
"""
Apply shared layout settings for grid-based figures.
"""
fig.update_layout(
height=height,
width=width,
margin=margins,
plot_bgcolor=background_color,
)def apply_grid_formatting(
fig,
n_rows,
n_cols,
row_titles,
column_titles,
title=None,
):
"""
Apply all shared formatting to a grid-based Plotly figure.
"""
hide_subplot_axes(fig, n_rows, n_cols)
add_column_labels(fig, column_titles, n_cols)
add_row_labels(fig, row_titles, n_rows)
add_title(fig, title)
apply_shared_layout(fig)
Population & Sampling
df = make_population_df(counts, seed=RANDOM_STATE)df.head()| color | color_index | x | y | global_index | |
|---|---|---|---|---|---|
| 0 | Red | 0 | -0.475623 | -0.623990 | 0 |
| 1 | Red | 1 | -0.439964 | 0.564339 | 1 |
| 2 | Red | 2 | -0.656083 | -0.781308 | 2 |
| 3 | Red | 3 | -0.489773 | -0.189746 | 3 |
| 4 | Red | 4 | -0.501344 | -0.511826 | 4 |
df_population = df.copy()

for label, cfg in sampling_config.items():
    colname = label.lower().replace(" ", "_").replace("%", "")
    df[colname] = compute_draw_count(
        df_population=df_population,
        frac=cfg["frac"],
        is_subset=cfg["is_subset"],
        replace=cfg["replace"],
        random_state=RANDOM_STATE
    )
Visualization
Sample Scatterplots
fig1 = create_subplots_fig(SUBPLOT_PARAMS)
add_sample_selection_grid(fig1, df, plot_grid, color_map)

apply_grid_formatting(
    fig1,
    n_rows=3,
    n_cols=3,
    row_titles=row_titles,
    column_titles=column_titles,
    title="Sample Selection by Method and Size",
)
Color Aggregation
fig2 = create_subplots_fig(SUBPLOT_PARAMS)
add_aggregate_color_grid(fig2, df, plot_grid, color_map)

apply_grid_formatting(
    fig2,
    n_rows=3,
    n_cols=3,
    row_titles=row_titles,
    column_titles=column_titles,
    title="Aggregated Outcome",
)
Final Plots
fig1.show()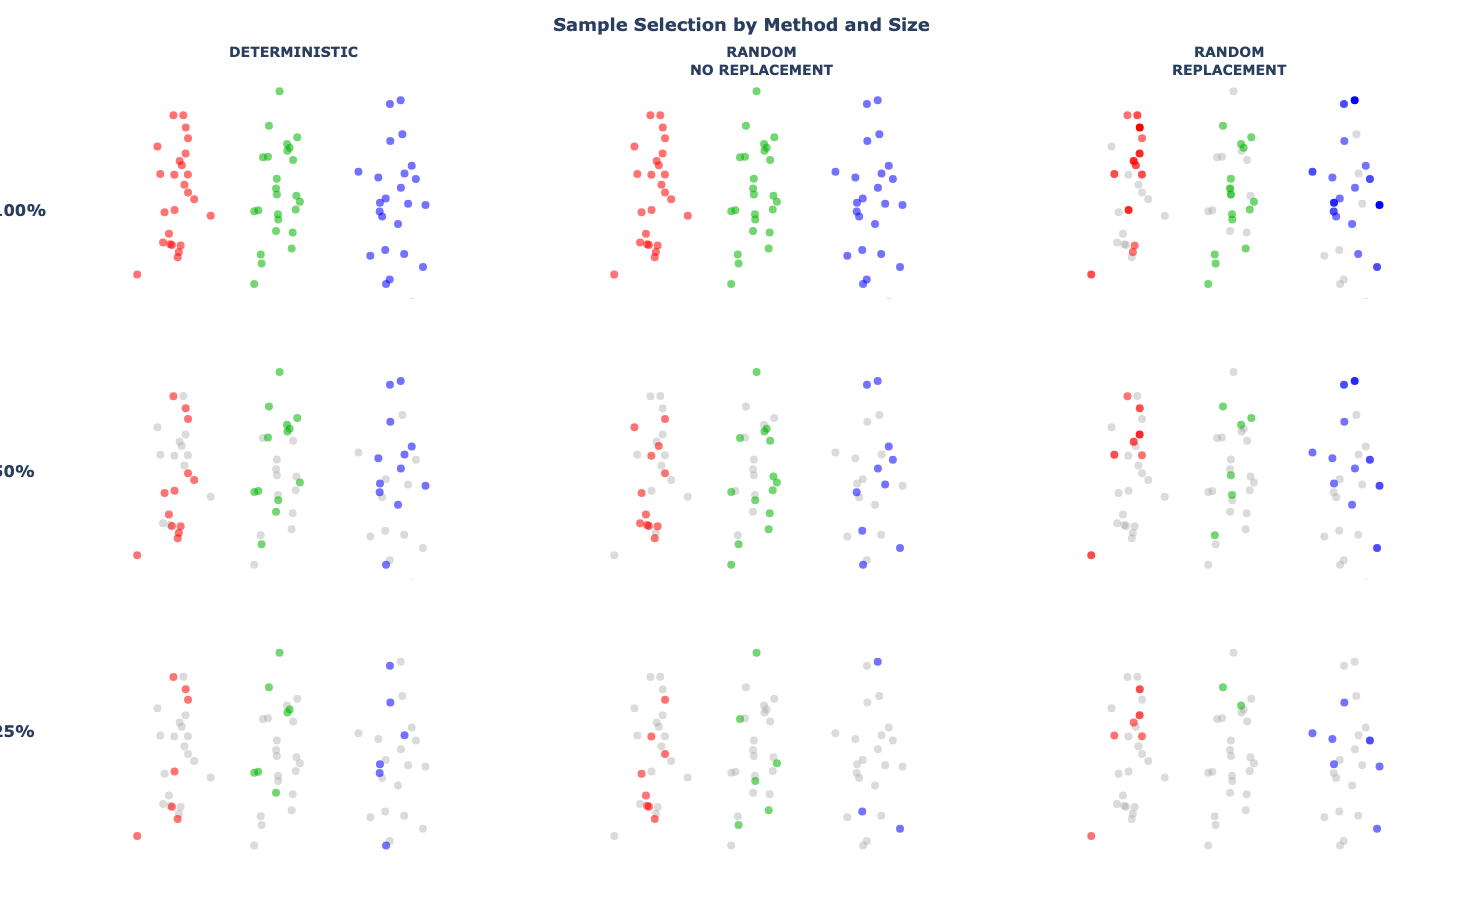
fig2.show()