Face Value: When Benchmark Accuracy Doesn’t Mean What You Think
How weak supervision with stock photos outperformed curated datasets on real-world emotion recognition
The Problem Nobody Talks About
Emotion recognition is one of those fields where leaderboard performance and real-world utility have quietly diverged. Models trained on FER2013 or RAF-DB post impressive test accuracy — 71% and 90% respectively in my tests — and then produce completely uninterpretable results when you point them at actual video content.
I wanted to understand why, and whether the problem was fixable without massive labeled datasets.
The short answer: it’s a data problem, not a modeling problem. And the fix turned out to be surprisingly simple.
The Setup
The standard approach to emotion recognition looks like this: take a curated dataset (FER2013 has ~35,000 labeled images; RAF-DB has ~30,000), train a classifier, evaluate on held-out test data, report accuracy. Higher accuracy = better model. Paper published.
The problem is what happens next. FER2013 images are 48x48 grayscale crops from Google image searches, many ambiguous or mislabeled. RAF-DB uses crowd-sourced labels on “in-the-wild” photos that skew heavily toward selfie-style compositions. Neither dataset looks anything like the faces you encounter in movies, surveillance footage, video calls, or any other downstream application.
I hypothesized that domain alignment between training data and target application matters more than dataset size or benchmark accuracy. If your training data looks like your target domain, a smaller, noisier dataset should outperform a larger, cleaner one that comes from a different visual distribution.
The Approach: Weak Supervision via Stock Photos
Rather than manually labeling thousands of images, I built training datasets using keyword searches on stock photo platforms (Pexels and Pixabay). The logic: stock photos of emotions are performed expressions in context — actors expressing happiness, sadness, anger in staged but naturalistic scenes. That’s much closer to movie performances than lab-posed expressions or selfies.
Data Collection Design
The critical design decision was multi-keyword searches combined for depth and breadth. Instead of searching “happy face,” I combined related terms: happy + smiling + joyful. This approach:
- Casts a wider net across the visual distribution of each emotion
- Reduces platform-specific search algorithm bias
- Produces more varied lighting, angles, and demographics
I tested single-keyword versus multi-keyword collection systematically. Multi-keyword consistently produced better downstream models, and this replicated across both Pexels and Pixabay — which was important for ruling out platform-specific effects.
What I Kept and What I Cut
The initial pull included seven emotion categories. I dropped disgust and neutral early. Disgust had too few quality results across both platforms. Neutral was a conceptual problem — “neutral face” in stock photography returns posed blankness that doesn’t match how neutral actually presents in video (people talking, listening, thinking). Trying to force a category that doesn’t have a clean visual prototype creates noise that propagates through training.
Final dataset: roughly 4,000 images across five classes (angry, fear, happy, sad, surprise), with real class imbalance — happy had 1,387 images while surprise had only 185. I chose not to aggressively balance this. In real video content, emotions are not uniformly distributed. A model that’s seen more examples of common expressions isn’t necessarily worse for it.
Training: Nothing Exotic
The modeling itself was intentionally straightforward. ResNet18 pretrained on ImageNet, fine-tuned final layers, standard augmentation (flips, rotations, color jitter). MediaPipe for face detection. PyTorch with MLflow for experiment tracking.
I want to be explicit about this because it matters for the argument: the model architecture contributed nothing novel. Same backbone, same training procedure, same hyperparameter ranges as the FER2013 and RAF-DB baselines I trained for comparison. The only variable that changed was the data.
This is the whole point. When people reach for architectural complexity to solve performance problems, they’re often compensating for a data problem that no amount of attention heads or loss function engineering will fix.
Validation: Where It Gets Interesting
Test accuracy on held-out data told the predictable story. RAF-DB’s curated labels produced 90% accuracy. Face Value’s weakly supervised data managed 82%. FER2013 came in at 71%. If you stopped here, RAF-DB wins.
I didn’t stop here.
Movie Timeline Analysis
I ran all three models against approximately 60 full-length films, extracting predictions every 100th frame. The idea was simple: a good emotion recognition model should produce temporal patterns that reflect narrative structure. Comedies should show more happiness. Dramas should show more sadness. Emotional inflection points — reunions, conflicts, revelations — should produce visible shifts.
This is what I mean by ecological validation: testing whether model outputs are interpretable and useful in a realistic downstream task, not just whether they match held-out labels from the same distribution.
What the Models Actually Produced
Face Value generated emotion timelines with visible narrative structure. Across comedies, dramas, and action films, the model’s predictions varied by genre and tracked recognizable plot points — reunions, conflicts, resolutions.
RAF-DB collapsed. Despite 90% test accuracy, it predicted “surprise” as the dominant emotion in roughly half of all movies. Timelines were flat — linear accumulation of surprise with minimal variation across genres or narrative beats.
FER2013 was worse. It predicted “angry” for approximately 98% of all frames across all movies. Essentially useless.
Why This Happened
The failure mode is domain mismatch. RAF-DB’s training data is dominated by selfie-style close-ups with exaggerated expressions. When the model encounters movie frames — medium shots, varied lighting, subtle expressions, faces in profile — it maps most of them to “surprise,” likely because the open-mouth, wide-eye features of surprise are the closest match to its training distribution. FER2013’s tiny grayscale crops are even further from movie frames, producing near-total collapse to a single class.
Face Value’s stock photo training data includes more varied compositions, lighting conditions, and expression intensities. The domain gap to movie content is smaller, so the model’s predictions retain meaningful variation.
See It For Yourself
I can describe these differences, but the comparison is more convincing when you look at it directly. The interactive results dashboard lets you explore predictions across all ~60 films, compare models side-by-side, and draw your own conclusions. What follows are two examples that illustrate the pattern.
Comedy Films: Does Genre Show Up in Predictions?
If an emotion model works, comedies should look different from dramas. Here’s the emotion distribution across eight comedies — from Airplane! to Seven Psychopaths — for both models:
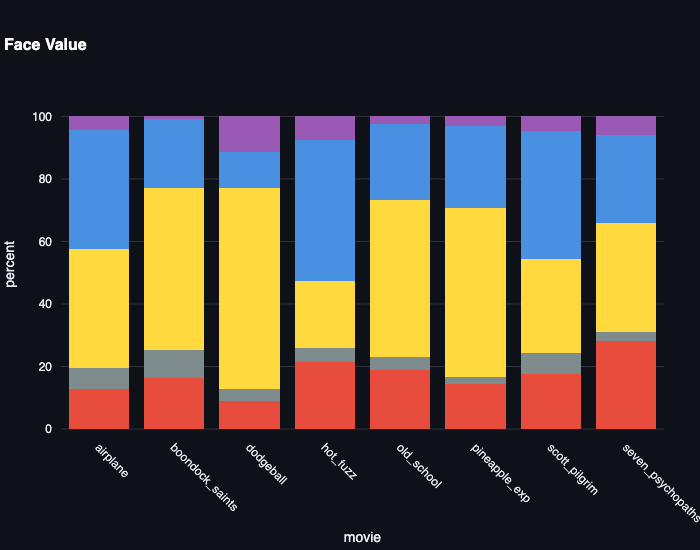
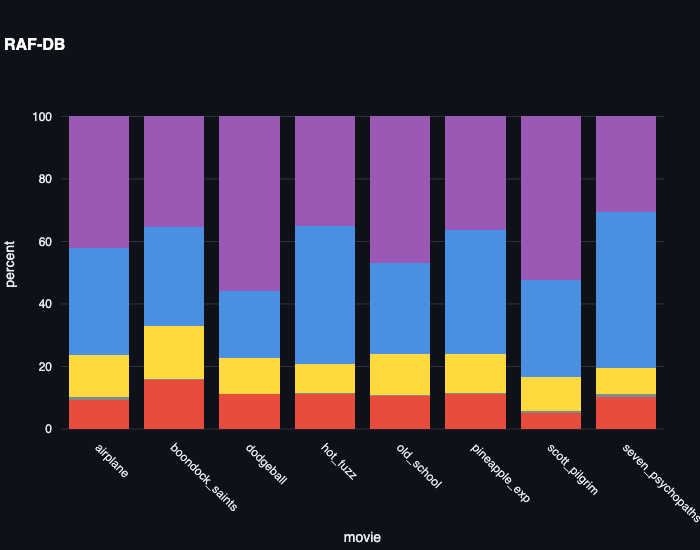
Face Value shows comedies dominated by happy (yellow) and sad (blue), with meaningful variation between films. Boondock Saints and Dodgeball have different emotional profiles, which tracks — they’re very different movies. RAF-DB shows the same purple-dominated (surprise) distribution for every film regardless of content. The model is insensitive to genre.
Finding Nemo: Can the Model Detect a Reunion?
Finding Nemo has a clean narrative test: Nemo is lost at ~14 minutes and reunited with Marlin at ~84 minutes. A model that captures emotional content should show a detectable shift at the reunion.
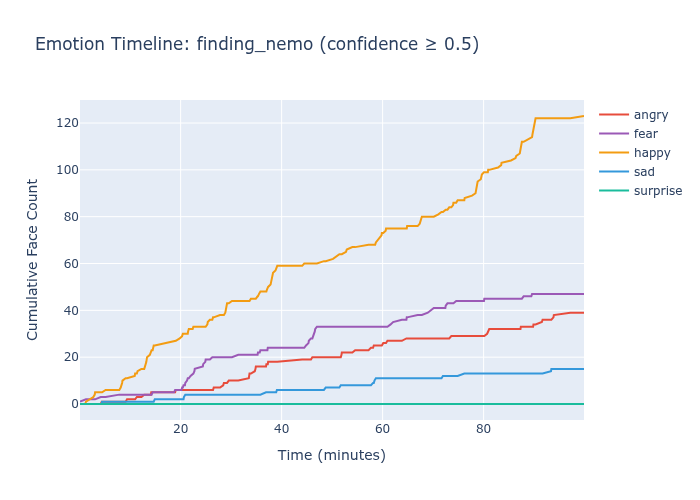
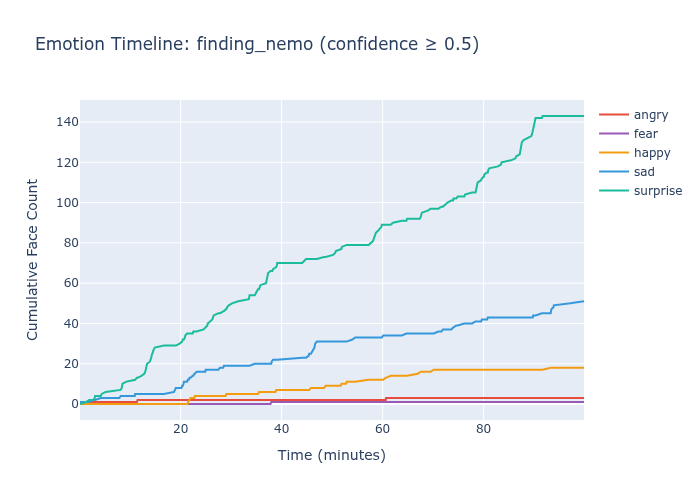
Face Value shows a visible happy surge in the final act. RAF-DB shows flat surprise accumulation — the reunion doesn’t register.
These aren’t cherry-picked gotchas. The pattern is consistent. Explore the full set on the dashboard and decide for yourself whether benchmark accuracy tells the whole story.
What I Got Wrong
This project has real limitations and I want to be upfront about them.
Sad bias. Face Value predicts “sad” as the dominant emotion in roughly 60% of films. The likely cause: stock photo searches for sadness return many contemplative, neutral-adjacent expressions. The model learned a broader definition of “sad” than intended. This is a genuine weakness that needs addressing through better keyword curation or post-hoc calibration.
Qualitative validation. The movie timeline analysis is compelling but subjective. I identified plot points and checked whether the model’s predictions aligned. That’s useful for building intuition but it’s not rigorous quantitative validation. Systematic evaluation with inter-rater reliability would strengthen these claims substantially.
Cherry-picked examples. The examples I highlighted — Finding Nemo, Real Steel, 300 — are cases where Face Value performs well. Comprehensive analysis across all 60 films would paint a more nuanced picture.
No ground truth. There is no standardized “emotional arc” annotation for movies. My validation relies on common-sense plot knowledge. Reasonable people could disagree about when emotional shifts should occur.
What This Actually Demonstrates
Face Value is not a production emotion recognition system. It’s a proof of concept for a methodology:
Automated dataset curation via keyword-based weak supervision can produce models that outperform benchmark-trained alternatives on ecologically valid tasks. The approach is reproducible (the full pipeline runs in 2-3 hours), transferable (same method could apply to gesture recognition, activity classification, or any domain where stock photos exist), and resource-efficient (under 5,000 images, single GPU, no manual labeling).
For practitioners, the actionable takeaway is this: before investing in larger datasets or more complex architectures, examine the domain alignment between your training data and your actual application. A smaller dataset from the right distribution will often beat a massive dataset from the wrong one.
Technical Details
The full codebase, training configs, and data collection scripts are available on GitHub. The repository includes everything needed to reproduce the pipeline end-to-end.
An interactive results dashboard lets you explore the movie-level predictions and model comparisons directly.
For questions about the methodology or potential applications of this approach, reach out via Dexterous Data.